Guild Wars Viz
Analyzing Guild Wars 2 Player Data
Guild Wars 2 is a MMORPG (Massively Multi-Player Role Playing Game). I played it briefly and wanted to experiment with creating data art using SVG filters and the game's data.
The ending result, an interactive visualization of player demographics at GuildWars2Viz.com , was featured in a number of Guild Wars related websites and viewed over 100,000 times.
Data Visualization for Games
With the Guild Wars 2 visualization, I wanted to create a visualization that evoked a strong emotional experience. The goal was to encourage users to tell a story about themselves and how they compare to others. The second goal was to communicate the data.
Data Art
The primary goal of a good data visualization is to effectively represent the underlying data. Many data visualization practitioners eschew "chart junk," or anything that takes away from the representation. However, adhering to this principle too strongly can lead to creating visualizations that neglect the experience the visualization creates. I abandoned this notion for the Guild Wars experiment and focused more on data art than data visualization.
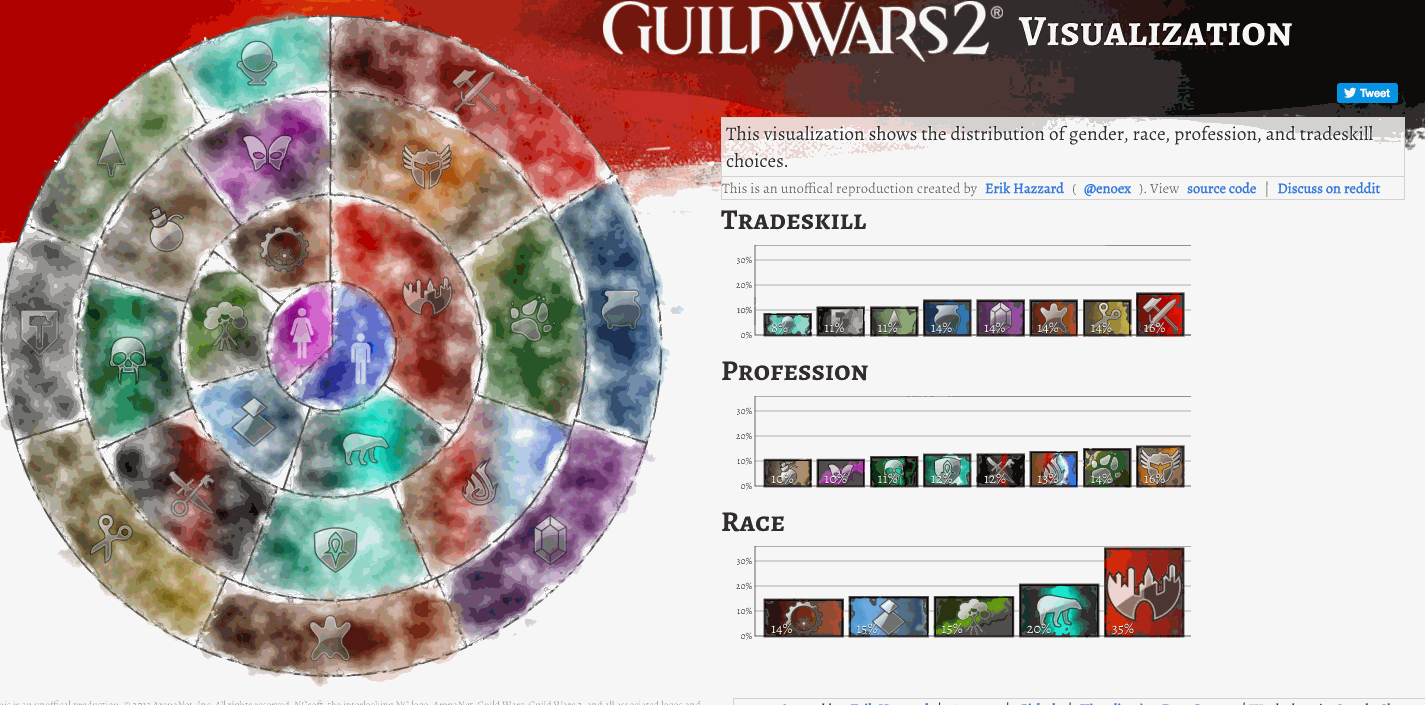
The result was a combination of stacked donut and pie charts with heavy filter use to create a water-color effect that matched the game's aesthetic. Each layer represented a choice the character made during the creation process - gender, race, profession, and tradeskill.
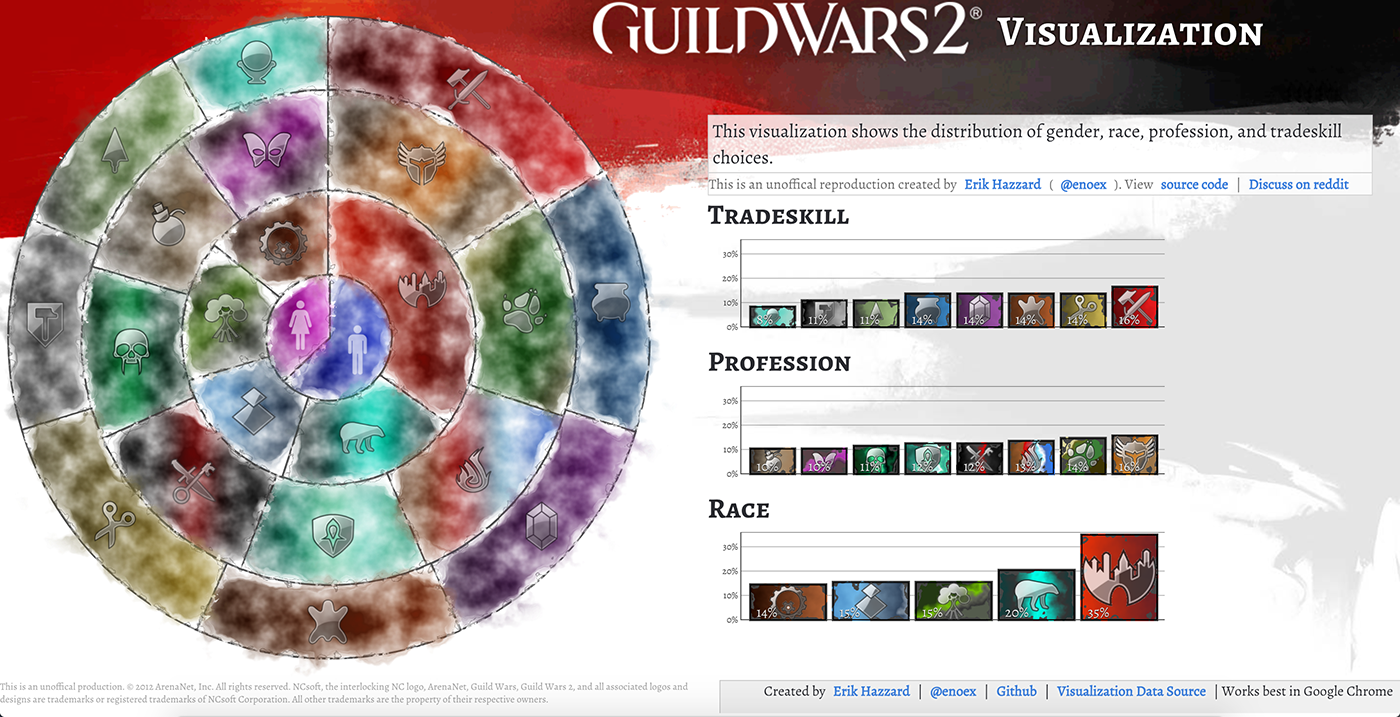
Guild Wars 2 Visualization
Sourcing Data
At the time, NCSoft, the company behind Guild Wars, did not release much data about the game nor did they have a public API. I desired to experiment with SVG filters and wanted to visualize the choices players made when creating their characters. Serendipitously, NCSoft recently released an image of player demographics. Unfortunately, there was no data behind the chart. It was simply a low resolution image containing a few and pie charts.
Published Guild Wars Demographic Data
From Charts to Infographic
Because the underlying data was not published, I measured the dimensions of each group to calculate the demographic percentages. This was not a precise process, and because the raw data was inaccessible, there was a loss of fidelity in the process. However, the goal of the visualization was to inspire in the viewer a curiosity that would lead them to question and explore player choices, so accuracy was not a primary concern.
Guild Wars 2 interface elements employ a sort of grungy abstract, water-paint aesthetic that incorporates heavy, fast brush strokes.
Guild Wars 2 In-Game Screenshot
I wanted to capture this style in a visualization. Before making any data visualization choices, I tried to match the artistic style. To accomplish this, I used SVG Filters (view my blog post on using filters). Using filters, we can make vector art appear to be raster art that fits nearly any artistic style we can imagine.
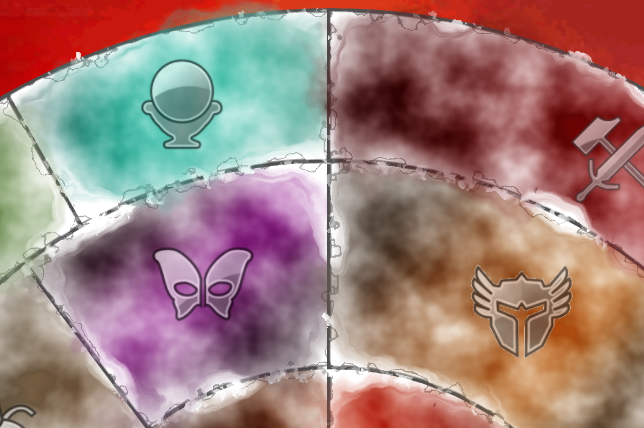
Close up of filter effects
The visualization choice itself was second. Unfortunately, I was limited by not having access to the underlying data. The source data graphic also did not allow asking hierarchical questions (e.g., how many people selected "male", then "human", then "warrior?").
Another constraint was that I wanted the entire visualization to fit into a single consumable square. Showing multiple bar charts alone made it feel disjointed. I used layers of donut charts which radiated out from a pie chart. While it may appear to be a sunburst chart, the data is not hierarchical. I ended with this choice because I felt it was able to encourage a strong connection for players with the data.
Telling a Story: Matching Visualization to In-Game Choices
I wanted to encourage players to connect to the visualization. To be able to tell themselves a story of the choices they made, and encourage them to consider how unique their choices were.
The ordering of the donut charts matched the in-game character creation choice process. This was an subtle, but important choice I wanted to preserve. At the center of the visualization is the choice of gender, which was the first in-game choice during character creation. Next is race choice (human, "elf", etc.). Then profession (e.g., warrior), then tradeskill.
By matching the order of donut charts to the progression of in-game character creation choices, it was immediately understand to Guild Wars players. Few questioned if the data was hierarchical because of this progression. Because of this progression, players were able to create a story as they explored the visualization.
The donut charts felt more "real" then taking in four bar charts at once. "I chose Male, then I chose Human. I wonder how many others picked that? Then what about Warrior, how many people had my same choice?" These questions naturally followed as the donut chart was explored. Four bar charts alone can encourage this behavior, but packing the story together in a linear fashion that matches the in-game creation flow proved more powerful.
Interaction Design
Providing interaction was critical to encouraging the user to further explore the data without being overwhelmed.
Interactivity
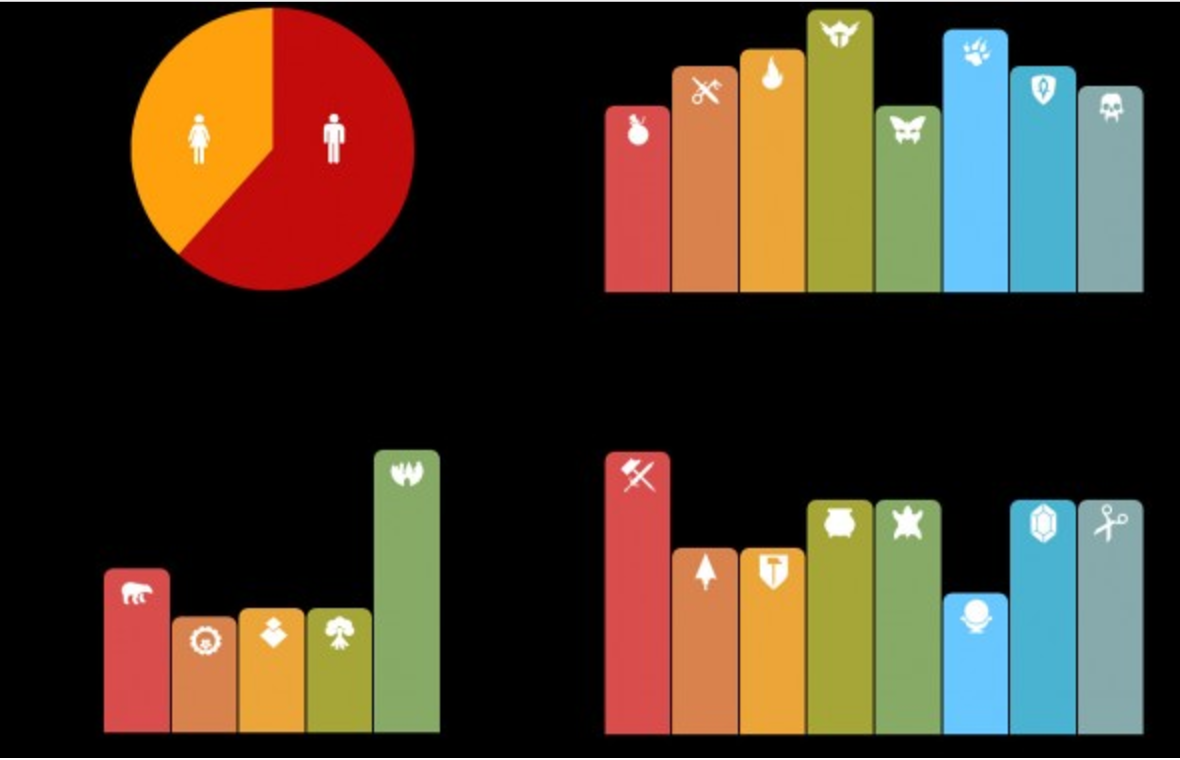
The interactions helped to clarify the structure of the visualization. On mousing over a segment of the donut chart, the segment highlights and another filter effect is applied. All other segments in that group also fade in text and percentage values, clarifying what group each section belonged to. For instance, highlighting over the "warrior" profession segment reveals information about every other profession.
Bar charts for each category existed on the side. These charts also had a filter effect applied to them. The goal of these charts was to provide a clearer, more effective representation of the data. On mousing over a segment of the donut charts, the corresponding bar chart becomes highlighted and a filter effect is applied.
Areas for Improvement
While SVG filters are expressive, powerful tools; they are also unreliable. Effects are inconsistent across browser. Performance is often terrible, especially with any kind of user interaction that results in a reflow or a repaint. It took a lot of tuning to make the Guid Wars Visualization as usable as it is in its current state, so strong constraints exist with artistic freedom and browser rendering performance.
With inconsistencies and performance issues in mind, a better approach may have been to rasterize the final design (as opposed to letting browsers render the output with SVG filters). This would have resulted in more consistent visual output across browsers, and would have been much faster for the end user. As it stands, though, the main drive for this project was to explore the limits of SVG and SVG filters, so in this case the tradeoffs were acceptable.
Conclusion
By combining data art and data visualization, we are less constrained in the types of experiences we can create. The goal was to venture into the realm of data art, to experiment with eschewing some religious data visualization principles for the sake of creating a compelling hook that would encourage more data exploration.
Overall, I am happy with the result. I was successfully able to create chart junk and spark discussions and interest in data viz among a wide audience. Many Guild Wars fan sites included a screenshot of the page which featured only the donut charts, as it a more compelling and sharable hook. Its virality and discussions around it within the Guild Wars 2 community lends credence towards the notion that a strong hook can be more engaging than a traditional visualization. The final result can be found at GuildWars2Viz.com.